Field goal percentage tells you what happened. ShotIQ tells you why it happened and what is going to happen next.
A player drains five shots in a row. The crowd goes wild. The stat sheet looks great. But here is the question nobody in the building is asking:
Were those good shots?
That is where ShotIQ comes in. It is a proprietary metric, rated on a scale of 0 to 10, that measures the quality of a player’s shot selection completely independent of whether the shot actually goes in. Not the outcome. The decision.
Because the two are not the same thing. Not even close.
Why FG% Only Tells Half the Story
Here is the reality of shooting statistics: they are heavily influenced by variance. A player can go 8-for-10 one night and 3-for-10 the next on identical shots. Field goal percentage tells you what happened on those nights. It does not tell you whether those were good decisions in the first place.
Shot selection is a habit. A skill. Something coaches can actually develop. ShotIQ measures it.
A player can take a terrible shot and make it. They can also take a perfect shot and miss. FG% captures the result. ShotIQ captures the reasoning behind it. And in a game where possessions are finite, reasoning matters as much as results.
Every shot a player takes receives a ShotIQ score based on:
- Shot distance and location: rim, paint, midrange, corner three, wing three.
- Shot type: layup, dunk, jumper, floater, hook shot.
- Defensive pressure: open or contested.
- Game context: shot clock, game clock, and situation.
The result is a complete picture of whether a player is making smart decisions with the ball, regardless of whether it is falling on any given night.
- Is this player taking good shots that just are not falling? Or are they genuinely struggling with shot selection?
- Is this player shooting well right now but relying on shot types that are not sustainable over a full season?
- Which players are maximizing expected points per attempt? Which ones are leaving points on the table?
- Where should this player be looking to score based on their actual tendencies and efficiency by zone?
For coaches, those are development questions. For scouts, they are evaluation questions. For players, they are accountability questions.
ShotIQ does not pick favorites. It just reads the decisions.
Same Score, Different Routes: How ShotIQ Works in Practice
The most interesting thing about ShotIQ is that it rewards smart decision-making regardless of playing style. Two players can post nearly identical scores while operating in completely different ways. Here is what that looks like with real data from the 2025-26 season.
Comparison 1: The Paint Presence vs. The Perimeter Threat
Dylan Faulkner, Samford
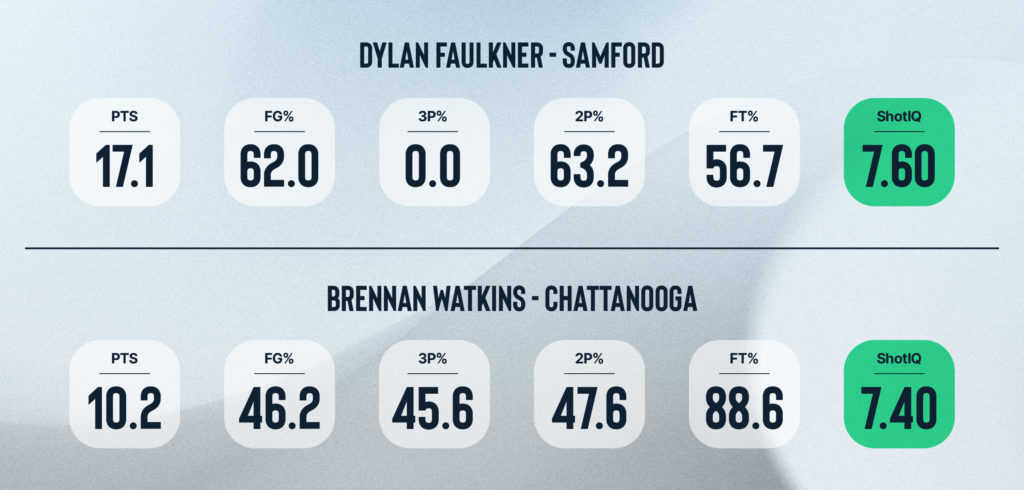
On the surface, Faulkner’s 62% field goal percentage looks elite. Watkins is shooting 46%. You would assume Faulkner’s shot selection is miles better.
But their ShotIQ scores are nearly identical. Here is why.
Faulkner lives at the rim. No three-pointers. Every attempt is a paint shot, and he is converting at 63%. These are high-percentage looks the model expects to go in at a high rate. He is performing above expectation, but his shot selection is not generating extra value beyond what the location already provides.
Watkins is a three-point specialist shooting an elite 45.6% from deep. That generates 1.37 expected points per attempt on threes alone. Add in 88.6% free throw shooting, and Watkins is generating comparable value per possession from a completely different part of the floor.
Both players are making smart decisions. They are just doing it in different ways. ShotIQ recognizes both.
Comparison 2: Efficient Volume vs. Inefficient Volume
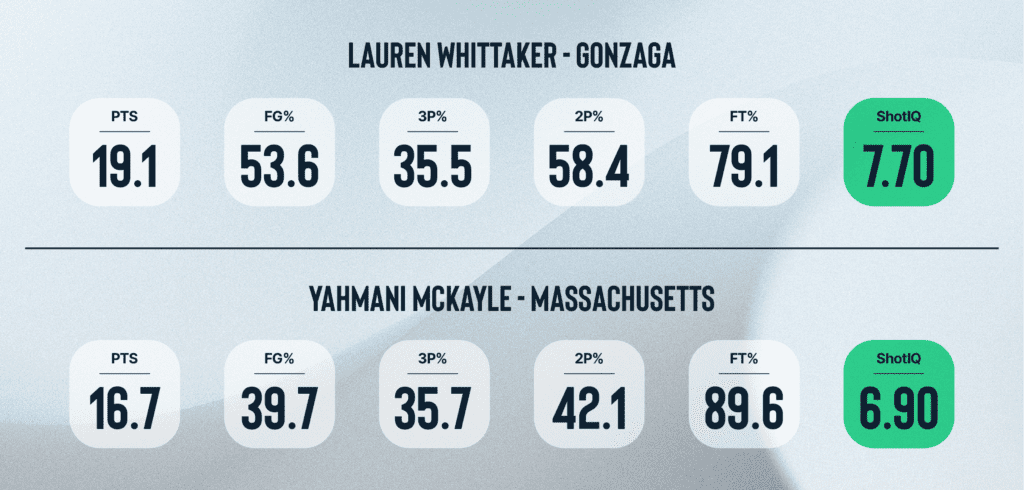
Both players take over 13 shots per game and attempted over 440 field goals this season. Volume-wise, they are peers. But that is where the similarity ends.
Whittaker converts at 53.6% overall, including 58.4% on two-pointers. She is not just taking a lot of shots. She is taking good shots. Her 19.1 points per game come on high-quality attempts, and her ShotIQ of 7.70 is among the best in women’s Division I as a result.
McKayle, despite nearly identical three-point shooting (35.7% vs. 35.5%), converts just 39.7% overall and 42.1% on two-pointers. She is scoring 16.7 points per game, but she is using more possessions to get there, and on lower-quality opportunities. That efficiency gap is exactly what ShotIQ captures.
Volume scoring is not inherently bad. It is about what you do with those attempts.
Whittaker proves you can be a high-usage player and still make elite decisions. McKayle’s 6.90 ShotIQ is not a verdict. It is a signal: there is room to improve shot selection, and finding better looks could boost efficiency without reducing her role or her usage.
That is actionable intelligence for a coach.
Comparison 3: Same Scoring, Different Decisions
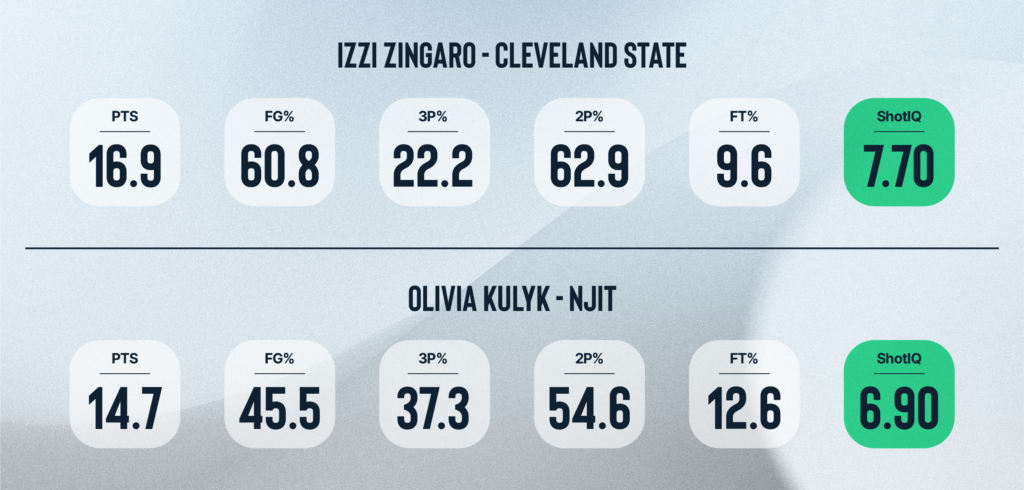
Both players score in the 15-17 point range. But their paths to that production tell completely different stories.
Zingaro takes fewer than 10 shots per game and converts 60.8% of them. She is selective, she is efficient, and her 62.9% on two-pointers tells you she is getting high-quality looks near the basket. Her 7.70 ShotIQ reflects that every attempt she takes is a calculated one.
Kulyk takes three more shots per game and converts at a significantly lower rate. She has range as a three-point shooter at 37.3%, but the volume of attempts on lower-percentage looks pulls her ShotIQ down to 6.90. Both players are productive. But one is doing it smarter.
The difference between a 7.70 and a 6.90 might not look dramatic on paper. On the court, over the course of a season, it compounds.
How to Use ShotIQ
ShotIQ is not just a number. It is a lens. Here is how each audience reads it differently.
- For players: A mirror. Are you making smart decisions? Where are you leaving points on the table? A high ShotIQ does not just mean you are a good shooter. It means you are a smart one.
- For coaches: A development roadmap. Which players need shot selection work? Who deserves more touches in designed sets? Where should your offense be generating looks? ShotIQ tells you where the decisions are breaking down before the field goal percentage does.
- For scouts: A predictive signal. A player with a high ShotIQ but average FG% is likely to improve as the decisions are already right and the execution will catch up. A player with a low ShotIQ but high FG%? Watch out. Eventually, variance catches up with bad decisions.
- For programs: A competitive edge. In a game where every possession matters, maximizing expected points per shot is not a nice-to-have. It is the difference between winning and losing close games.
The Bottom Line
ShotIQ does not replace field goal percentage. It completes it. Together, they tell the full story: not just whether shots are going in, but whether they should be going in. And in basketball, knowing the difference between a hot streak and a smart shooter is the kind of edge that does not show up anywhere else.
- A player who takes smart shots and makes them? Elite.
- A player who takes smart shots and misses? Coachable. The decisions are right; the execution will follow.
- A player who makes bad shots consistently? Risky. Because variance always catches up.
That is what ShotIQ measures. Not luck. Not hot streaks. Just decisions.
And in basketball, good decisions win games.
See ShotIQ in action at shottracker.com and request a demo here!