Note: “Bigs” includes Forwards and Centers. “FGA” refers to field goal attempts, “3FGA” refers to three-point attempts, and “FTA” refers to free throw attempts.
ShotTracker tracked shooting performance across two distinct late-game scenarios in the 2025-26 season. Part 1 focuses on close-game situations. What happens to shot distribution and efficiency when the score is tight and the clock is running out?
To analyze clutch shooting, we’re going to look at two different “clutch” scenarios. The first looks at close games with little time on the clock, specifically under four minutes in the second half, fourth quarter, or overtime, and the score within five points. The second “clutch” scenario only looks at late shot clock, specifically shots taken with five or fewer seconds on the shot clock.
- Close Game Scenarios – Who is taking the shots and how effective are they?
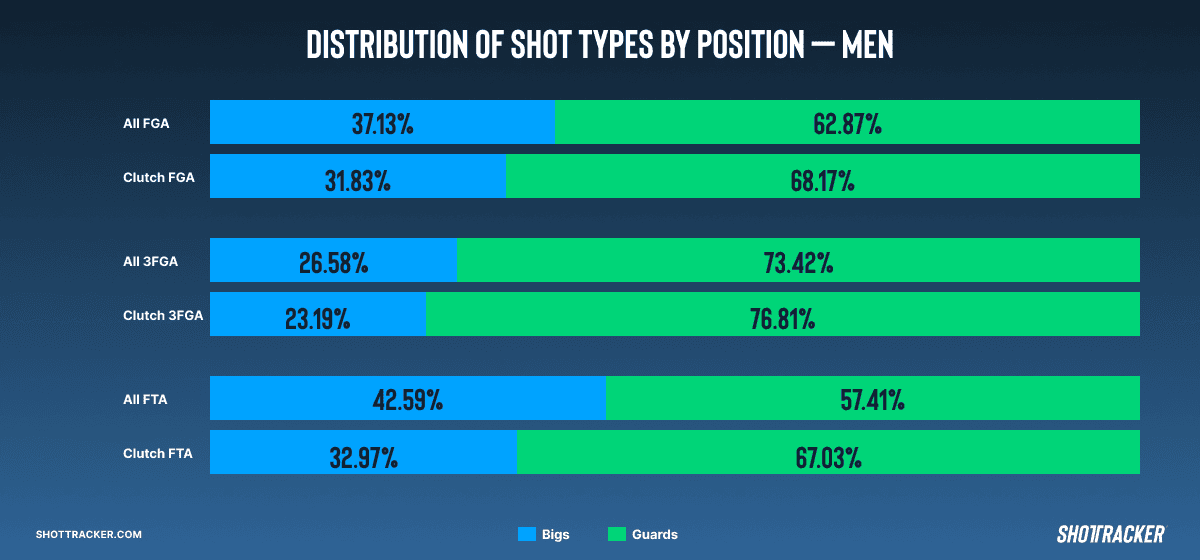
With little time on the clock and in a close matchup, guards are handling even more of the offense than usual. In the general run of a game, when looking at the entirety of the 25-26 NCAAM season, guards are taking 62.9% of all FGA, compared with bigs taking 37.1%. In this defined clutch scenario, there’s an even greater disparity, though, with guards taking more than two-thirds of all FGA (68.2% versus 31.8% for bigs). The distribution change of 3FGA from the entirety of game to clutch is marginal, but there is a massive swing in who is taking free throws at the end of close games. In the regular run of play, guards take 57.4% of all the FTA, but in the clutch they jump up nearly 10 percentage points to 67.0%.
Despite the perception that opposing teams may target poor free throw shooters late in games, guards still account for 67% of all clutch free throw attempts in the men’s game. That suggests the ball remains in guards’ hands throughout many late-game possessions, limiting opportunities to exploit poorer free throw shooters.
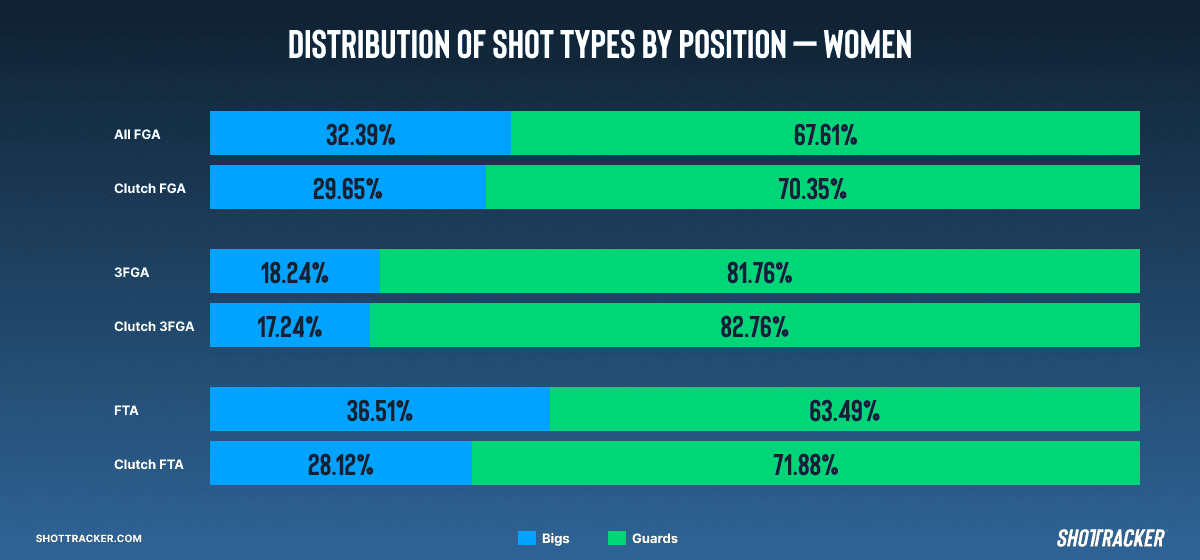
The gaps in the women’s game are smaller, although the trend remains true. Guards are taking more of the share across FGA, 3FGA, and FTA. It’s a much smaller gap in FGA than on the men’s side, though, going from guards having a 67.6% share over the course of the whole game to 70.4% in the clutch. The difference in free throw share is again the largest, going up over 8 percentage points (63.5% to 71.9% for guards) – and bigs are only taking a quarter of the free throws at the end of close games (28.1%).
The smaller difference in FGA from whole game to clutch could be a testament to less individual guard creation and possibly more team offense late in the game, rather than running isolation or sets for 1-2 players only. That being said, guards still have the ball in their hands at a much higher rate when they get fouled late game.
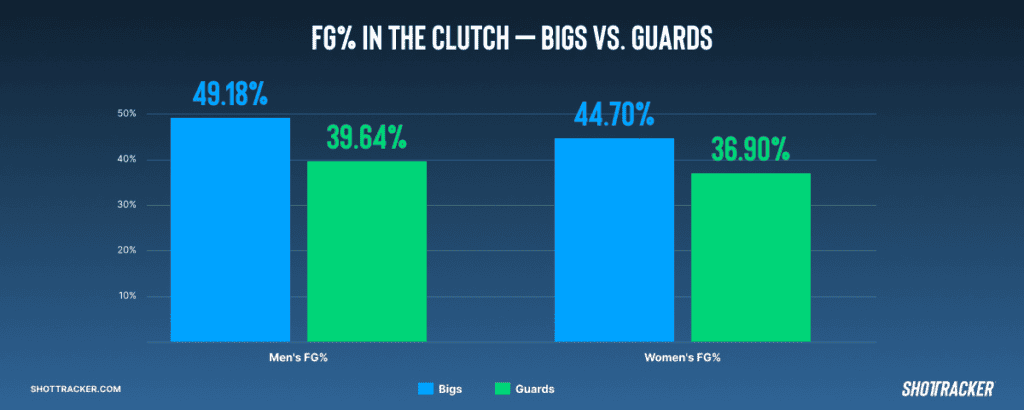
Interestingly, bigs are shooting much more efficiently than guards in clutch scenarios, 49.2% to 39.6% for men and 44.70% to 36.90% for women. The fact that bigs are only taking about 30% of shots suggests that late-game offense prioritizes shot creation over shooting efficiency. Teams appear willing to sacrifice raw efficiency because guards are simply much better equipped to create a shot against a set defense with the game on the line.
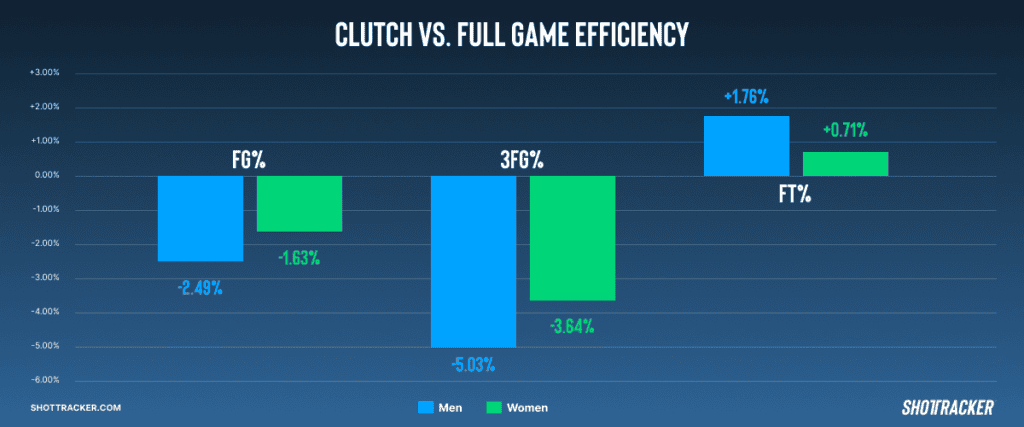
When looking at the general population of players, there is also a notable shift in efficiency in close, late game scenarios. Field goal percentage (FG%) and three-point percentage (3FG%) drop for both men and women when comparing clutch time to full game numbers. 3FG% has the most significant drop off, nearly five percentage points greater in the regular run of play for men and almost four percentage points better for women. This suggests defenses are particularly effective at limiting perimeter efficiency late in games, while offenses are often forced into more difficult three-point attempts.
Free throw shooting tells a different story. While field goal and three-point percentages decline in the clutch, free throw percentage actually improves—by nearly two percentage points for men and about one point for women. One possible explanation is that guards, who are typically stronger free throw shooters, account for a much larger share of late-game free throw attempts. Another is that free throws eliminate the defensive pressure and shot-creation challenges that make live-ball field goals more difficult.
These findings highlight that clutch offense is about much more than simply making shots. Teams rely more heavily on their guards, defenses force tougher looks, and overall efficiency declines as the clock ticks down and every possession becomes more contested. But not all clutch situations are the same. The second type of pressure situation, late shot clock possessions with five or fewer seconds to create a scoring opportunity, introduces a different kind of constraint and may produce a different pattern entirely. That analysis is coming in Part 2.
All data sourced from ShotTracker. Analysis covers Division I men’s and women’s basketball from the 2025-26 season. Want to see how your program’s clutch shooting data compares? Request a demo at shottracker.com/request-a-demo