What Is the ShotTracker Rating?
The ShotTracker Rating is a comprehensive performance metric built to evaluate player impact using ShotTracker data. Each score (out of 100) is proprietary to ShotTracker and derived from a blend of in-house box score statistics and advanced analytics.
Every player receives a game rating based on their performance in each contest, along with an overall season grade that reflects their body of work.
To better understand how these ratings come together, let’s take a look at a few players with similar season grades. We’ll compare their traditional box score production alongside their ST-Ratings to highlight how different styles of play can yield similar overall value.
While the exact formula remains confidential, these comparisons offer insight into the factors driving each player’s rating—and show that impact goes well beyond just scoring.
Comparison 1
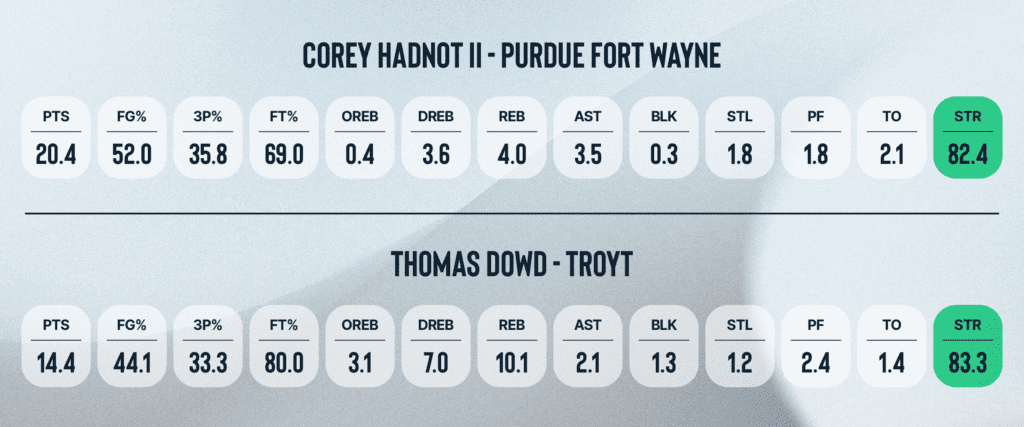
At first glance, a 20-ppg scorer should grade better than a 14-ppg scorer, right? Not necessarily. Scoring isn’t the only factor, and Thomas Dowd is a great example of a player who grades well without scoring 15+ points per game.
While both have exceptional grades, Dowd actually scores slightly higher due to his top-tier rebounding production—especially on the offensive glass. That, along with highly rated defensive metrics (1+ blk/g and 1+ stl/g), is what gives him such a high grade.
On the other side, Hadnot II’s grade is still elite. His scoring numbers, along with relatively high efficiency, plus assists and steals, all combine to give him an 80+ rating.
Comparison 2
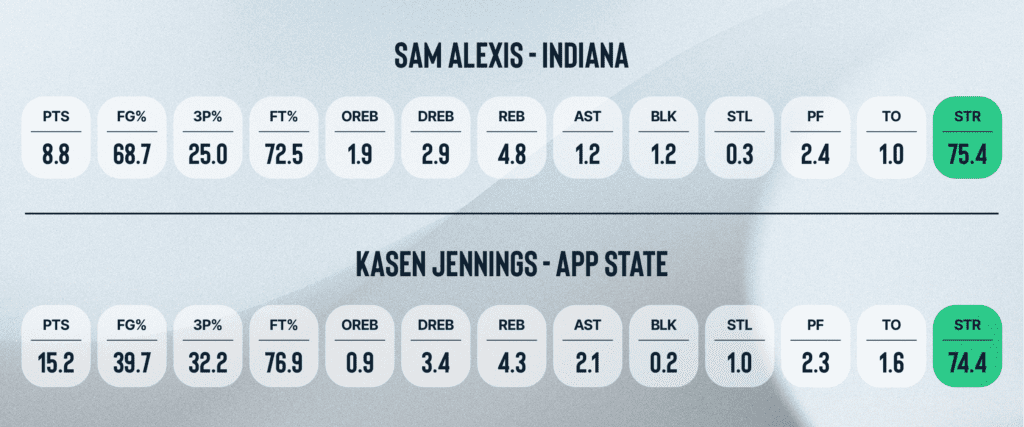
Sam Alexis and Kasen Jennings have nearly identical ST-Ratings, but their stat lines look drastically different. Alexis’ score is boosted by his elite efficiency—shooting nearly 70% from the floor. He’s productive and efficient, despite playing fewer minutes.
Jennings may score over 6 ppg more, but his inefficient shooting numbers aren’t helping his overall grade. His 15.2 ppg, along with average rebounding and assist numbers and 1.0 stl/g, still contribute to a solid score of 74.4.
Comparison 3
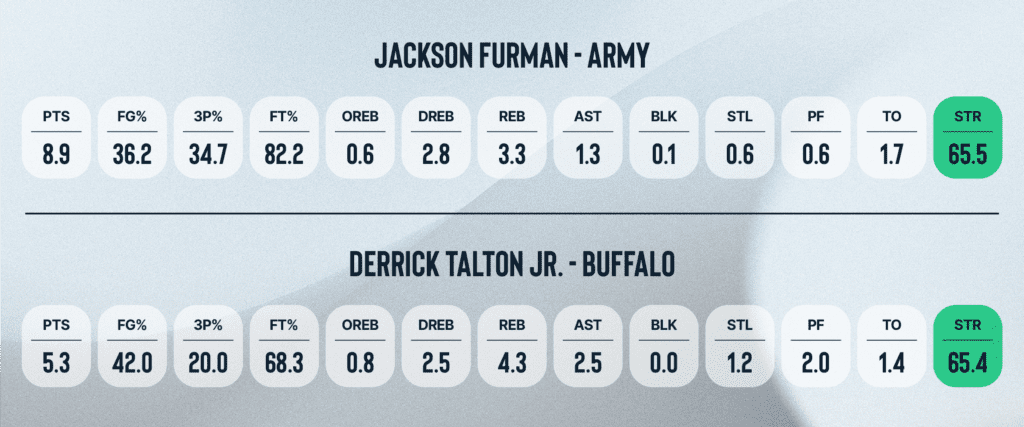
Jackson Furman and Derrick Talton Jr. also arrive at nearly identical ST-Ratings through very different paths. Furman’s production leans more toward scoring, averaging 8.9 ppg while shooting a strong 34.7% from three and an efficient 82.2% from the free throw line. His ability to stretch the floor and contribute across the board helps drive his rating.
Talton Jr., on the other hand, impacts the game in different ways. While his scoring numbers are lower at 5.3 ppg, his playmaking and defensive activity stand out. Averaging 3.5 assists/g along with 1.2 stl/g, Talton provides value as a facilitator and perimeter defender. His lower turnover rate also helps support his overall grade.
Despite the contrast in roles—Furman as more of a scoring option and Talton as a distributor and defender—their all-around contributions result in nearly identical ST-Ratings.
That’s the core of what these comparisons demonstrate. A 20-point scorer and a 14-point scorer can arrive at the same grade. A 69% shooter and a 39% shooter can land within a point of each other. Two players with completely different roles, one a stretch scorer and one a facilitating defender, can produce identical value for their team.
The ShotTracker Rating doesn’t flatten those differences. It accounts for them. Every block, assist, offensive rebound, and efficient possession gets factored in, because basketball has always rewarded players who contribute in ways the traditional stat line wasn’t built to capture.
The players who win games aren’t always the ones leading the scoring column. The programs that understand that are building rosters differently. The ones using data to find that value before anyone else does are the ones worth paying attention to.
Recruiting the right player means knowing their real value, not just their stat line. See how ShotTracker helps programs find it. Request a Demo!