Part 2 of our series on NIL investment and the 2026 NCAA Tournament
In Part 1, we looked at what it costs to build a tournament-caliber roster. This piece turns to what conferences got back from the tournament itself — not in recruiting leverage or donor momentum, but in direct tournament revenue.
Michigan cut down the nets in the men’s tournament. UCLA cut them down in the women’s. Both play in the Big Ten — which, not coincidentally, is the conference that spent more on NIL than anyone else in college basketball this year.
That symmetry is convenient for anyone arguing money wins championships. The full ROI picture is a little more complicated. Let’s look at why.
Recap – How the Unit System Works
To recap what was covered in Part 1 of our series, every game a team plays in the NCAA Tournament earns its conference a “unit.” In 2026, each men’s unit is worth roughly $2 million, paid out over six years. The women’s tournament runs the same system, launched in 2025, with units worth about $150,000 over three years from a $20 million pool.
The money doesn’t go to the school. It goes to the conference, which distributes it to every member — whether that member made the tournament or not. One team’s deep run can lift the entire conference. Comparing NIL investment to tournament revenue isn’t quite apples to apples, though. Neither tells the whole story, but together they tell part of one.
The Men’s Side: What the Numbers Show
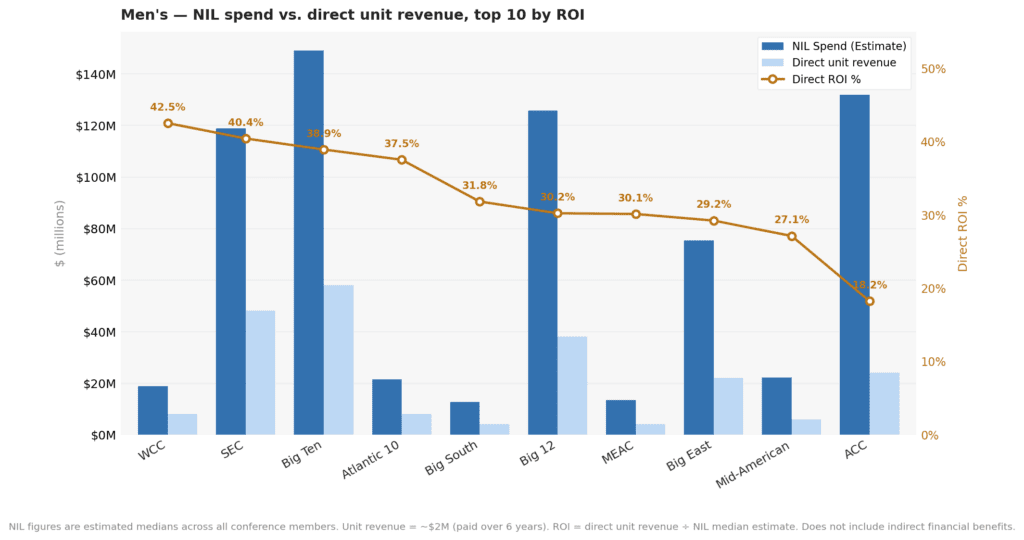
The West Coast Conference topped the men’s ROI at 42.5%. That’s not because the WCC is beating Power-5 conferences at recruiting — it’s because a smaller NIL base plus 4 revenue units wins produces a flattering ratio. Five of the top ten men’s conferences by ROI were mid- or low-major leagues. Get a team in the field, pull off an upset or two — VCU and Saint Louis did it for the Atlantic 10, which finished with an ROI of 37.5% — and the math takes care of itself.
The power conferences play a different game. The SEC (40.4%) and Big Ten (40.3%) finished in a near-tie at the top of the Power-5 pack, but they got there differently. The SEC put 10 teams in the bracket, sent four to the second weekend, and benefited from a slightly leaner NIL median relative to peers. The Big Ten put nine teams in and Michigan and Illinois carried the conference to the Final Four. Michigan won the whole thing, which is how you turn the largest NIL investment in the country into a defensible return.
Then there’s the Mountain West. One team in, one win, an estimated $66.8M–$96.3M in conference-wide NIL spend, and a 5.1% ROI to show for it. That figure is heavily distorted by a single program spending at near high-major levels, but the tournament result is straightforward. While a larger NIL investment buys a competitive roster, it doesn’t guarantee success in March.
The ACC’s 18.2% looks underwhelming until you remember it had the second-largest NIL spend of any conference and placed Duke in the Elite Eight – real tournament participation, just not the kind of deep run that moves the ROI column.
The Women’s Side: What the Numbers Show
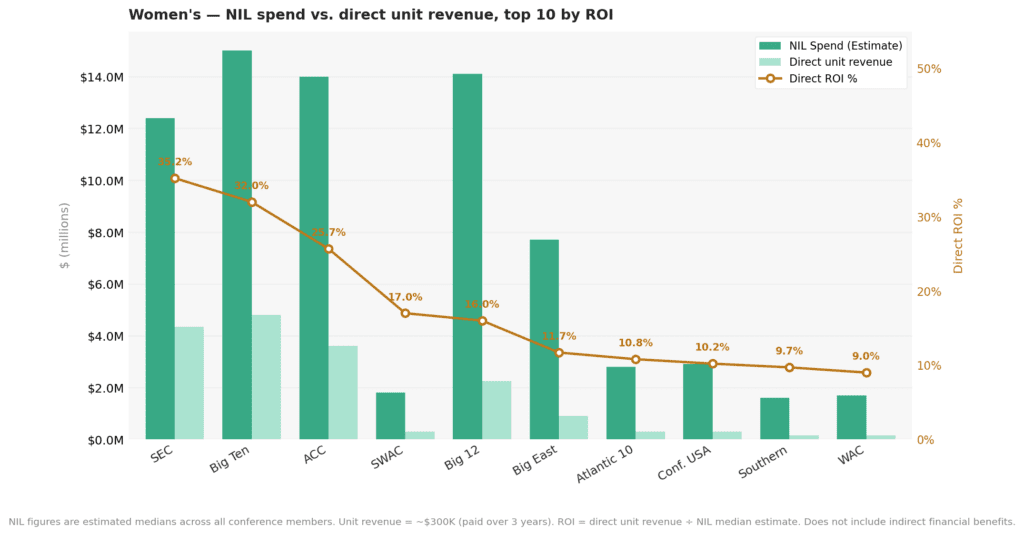
The SEC led the women’s field at 35.2% ROI. Ten teams in the tournament, 19 games played, 29 units earned, $4.35 million in direct revenue against an estimated $10.9M–$14.2M in NIL spend. South Carolina’s run to the Championship game – five wins before losing to UCLA – accounted for a meaningful chunk of that return.
The Big Ten finished at 32.0% with the largest women’s NIL investment in the sport. Twelve teams in the field, 20 wins combined, and UCLA’s first national championship doing exactly what a title run is supposed to do: justifying the spend. Without UCLA, the Big Ten’s return looks closer to the ACC’s 25.7%. With UCLA, it doesn’t.
The Big 12 is the cautionary tale on the women’s side. Eight teams in, only seven total wins, 16.0% ROI. TCU’s run to the Elite Eight accounted for half of their wins. The conference has invested in women’s basketball more than any other conference, and this year the investment didn’t translate into the kind of wins the unit system rewards.
What ROI Doesn’t Tell You
The ROI percentages here aren’t a ranking of who made the smartest decisions. A conference with a smaller NIL footprint and one deep tournament run can post a higher percentage than a power conference that sent ten teams and earned forty-eight million dollars in units – because the math rewards efficiency, not scale. The unit system pays a flat rate per game played, regardless of what a conference spent to get those teams on the floor.
Direct tournament revenue is not the primary financial return on NIL investment. It’s one of several streams – and not the largest. The more significant returns come through the contracts and media rights deals that tournament success drives, the donor and booster activity that competitive programs generate, and the recruiting visibility that keeps a program in the conversation for top talent year over year. NIL investment feeds all of those indirectly. A conference whose programs stop having success in the tournament doesn’t just lose units. It loses the platform.
That’s the actual logic behind the numbers. Conferences aren’t spending nine figures on NIL to recoup $2 million per tournament win. They’re spending it because the programs that can’t compete in the NIL market fall out of the recruiting cycle, and programs that fall out of the recruiting cycle eventually fall out of the tournament entirely – taking all of those downstream financial returns with them.
The direct ROI figures in this analysis capture one narrow slice of a much larger equation. What they show is that tournament participation generates real, measurable conference revenue, and that the relationship between NIL investment and that revenue varies widely depending on a conference’s size, composition, and how deep its teams ran. What they can’t show is the full cost of not investing – which may be the number that matters most.
Next up: We dig into who is getting the most – and least – out of every NIL dollar, and ask what that means for conferences trying to set their strategy for 2027.