In a study of more than 700 Division I Men’s and Women’s college basketball teams, 30 NBA teams and 13 WNBA teams, we analyzed shot-selection data from the 2024-25 season to uncover how shot mix and efficiency shape winning.
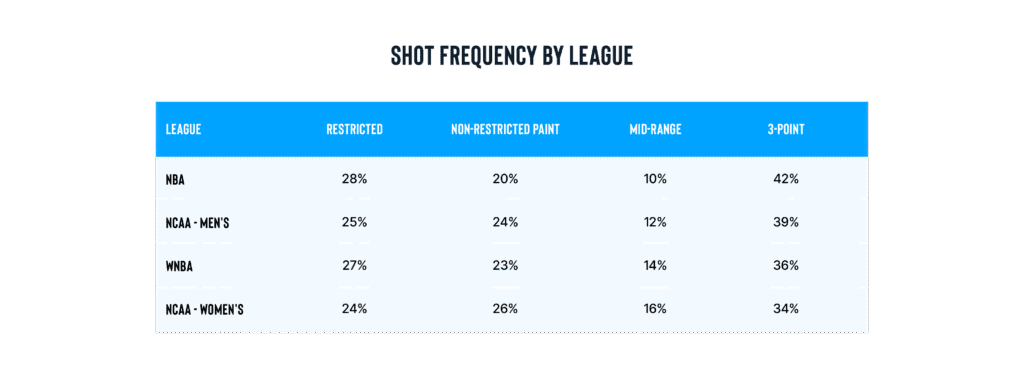
Using ShotTracker event-level game data paired with public NBA/WNBA data, we calculated the share of attempts from the rim and paint, mid-range, and three-point range, along with effective field-goal percentage (eFG%) and points per shot (PPS) to identify the offensive identity of each team.
We assumed professional teams would separate themselves through shot efficiency rather than shot mix. For the most part, all levels take roughly 50% of their shots in the paint and 50% from the perimeter. However, the professional leagues separate themselves from their college counterparts by taking more efficient shots, i.e., higher share in the restricted area and from 3-point range instead of mid-range.
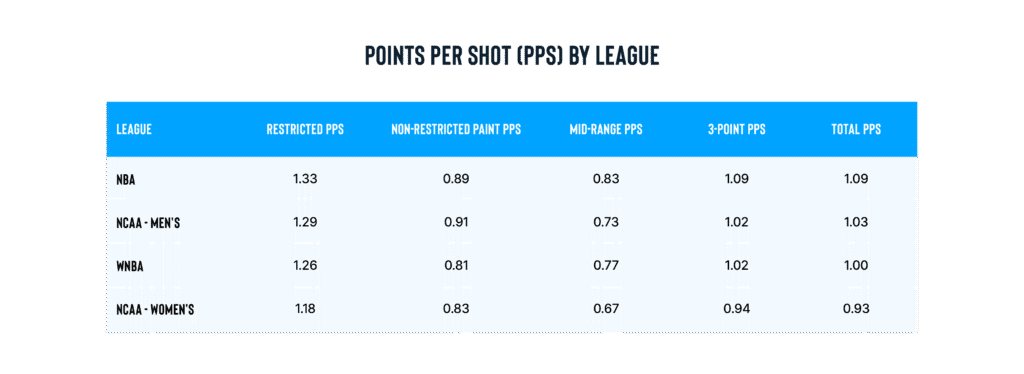
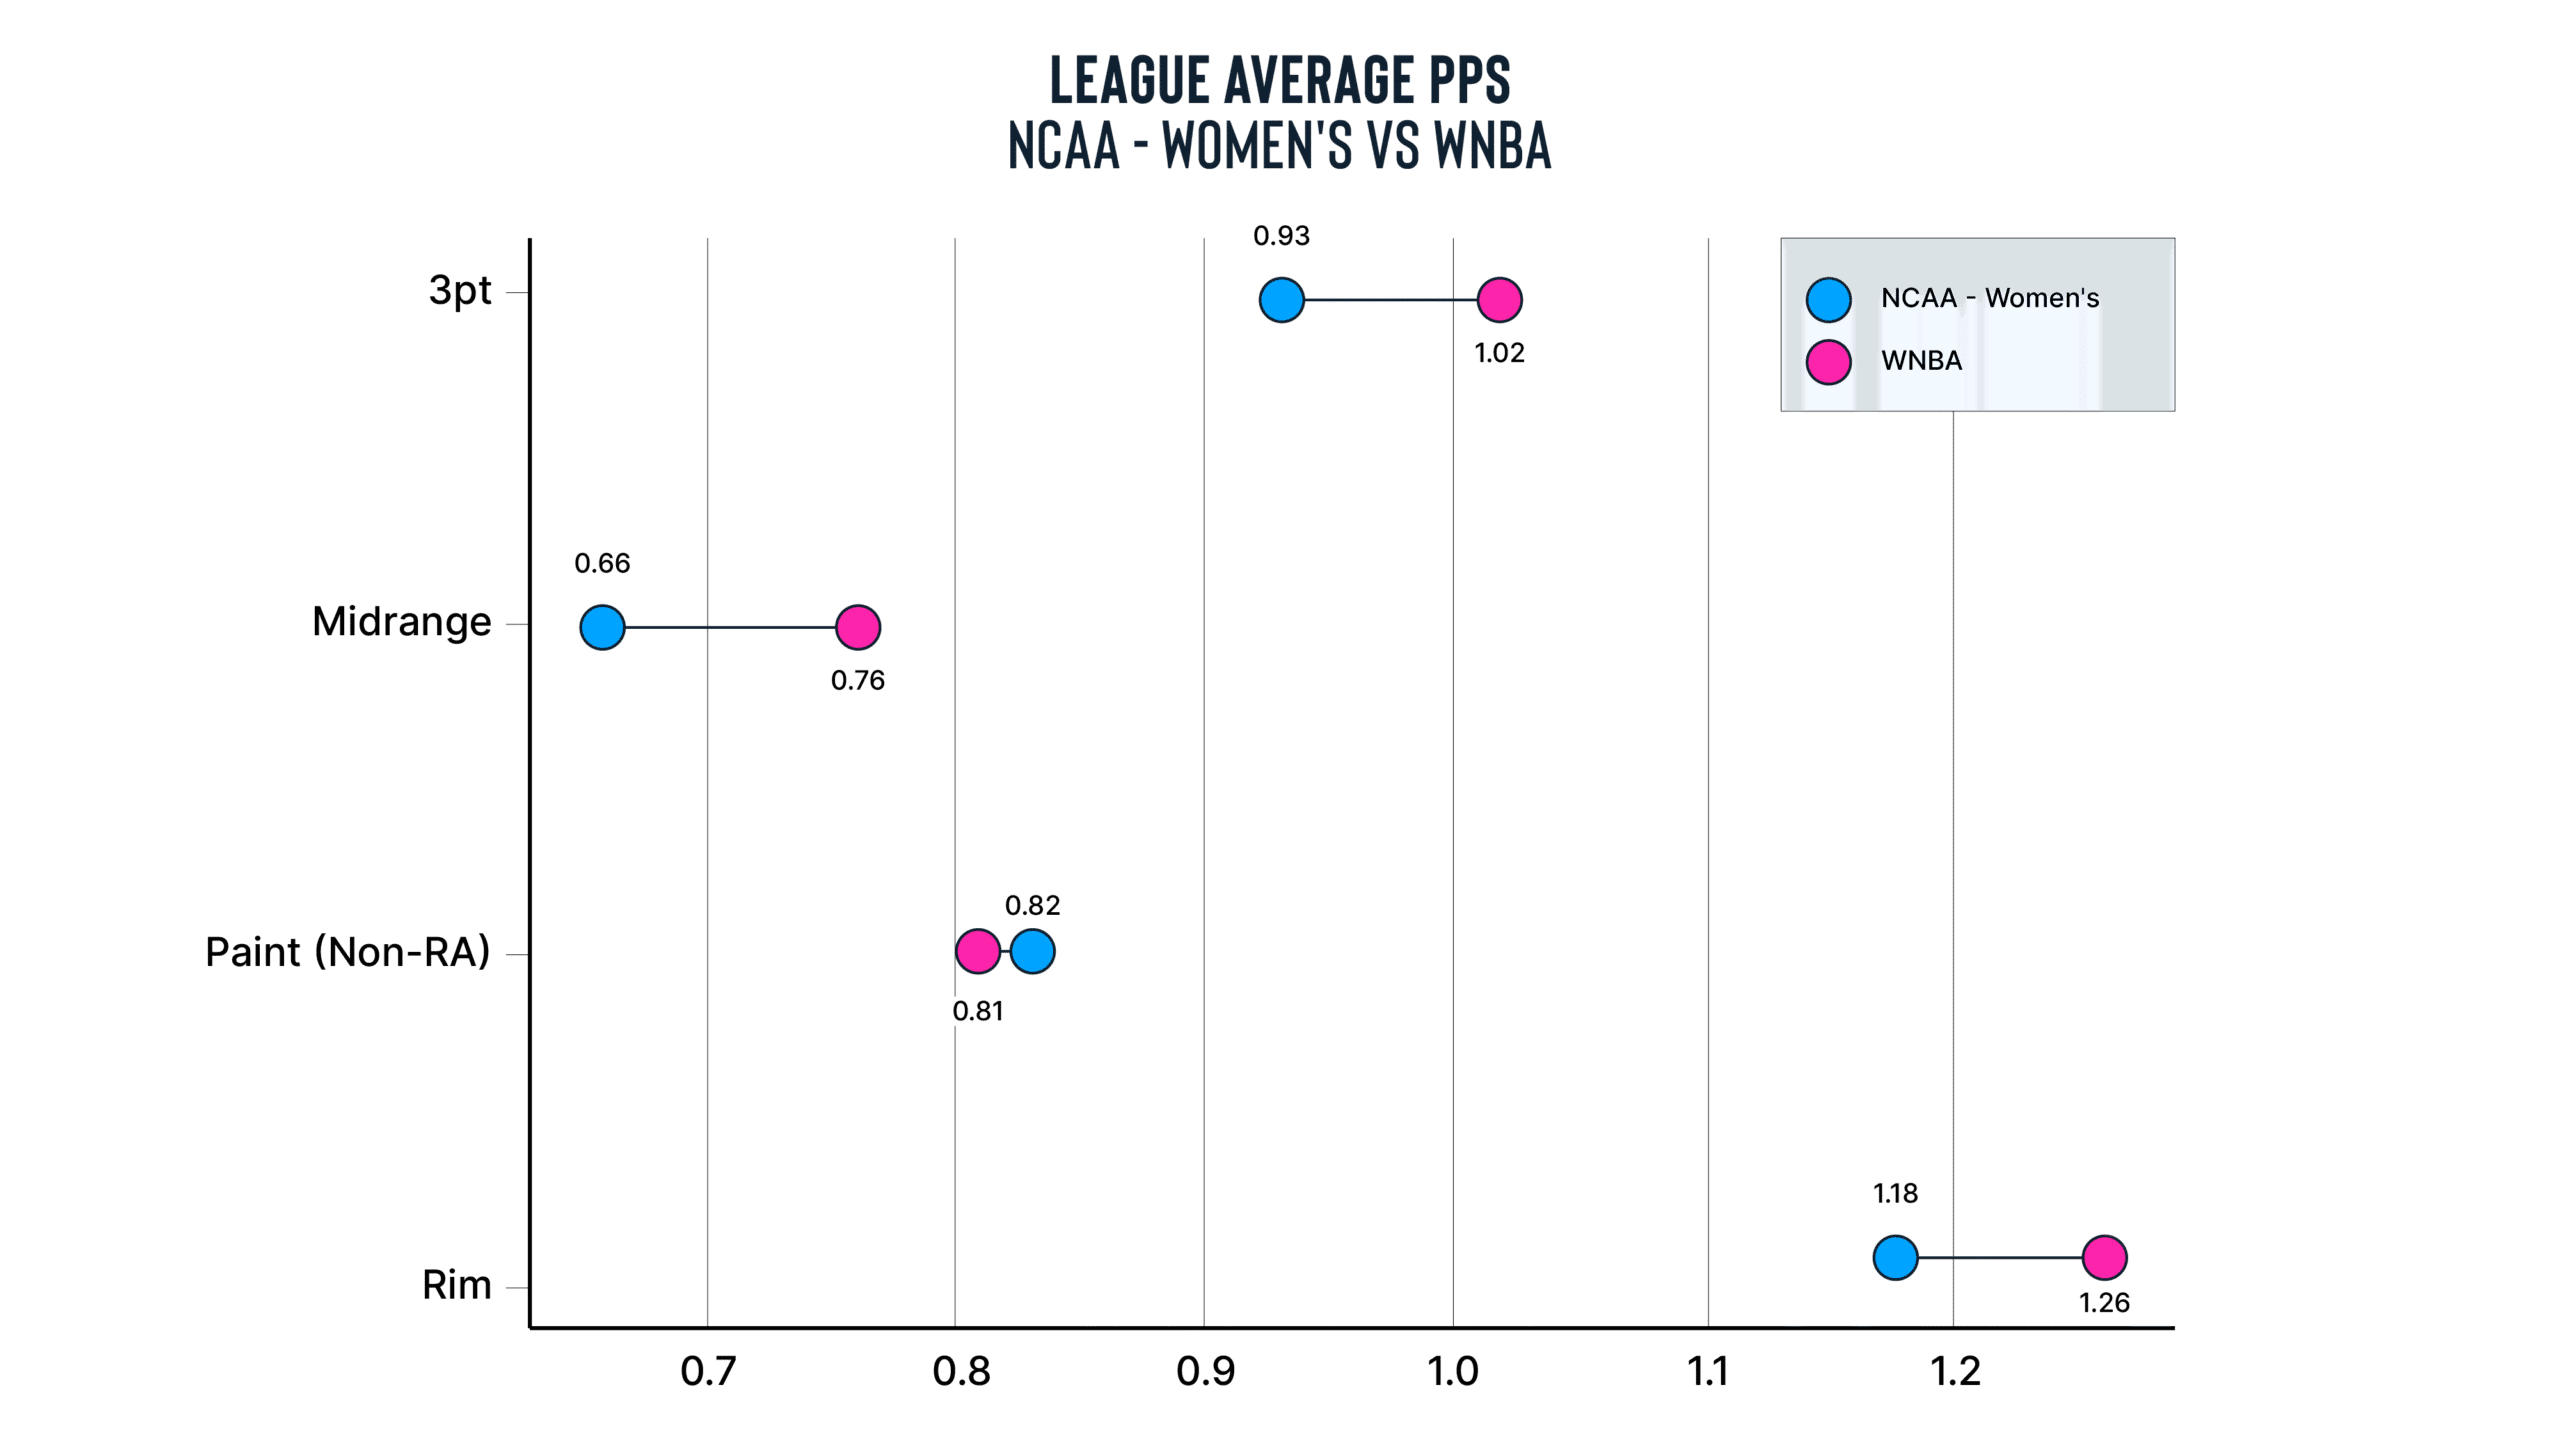
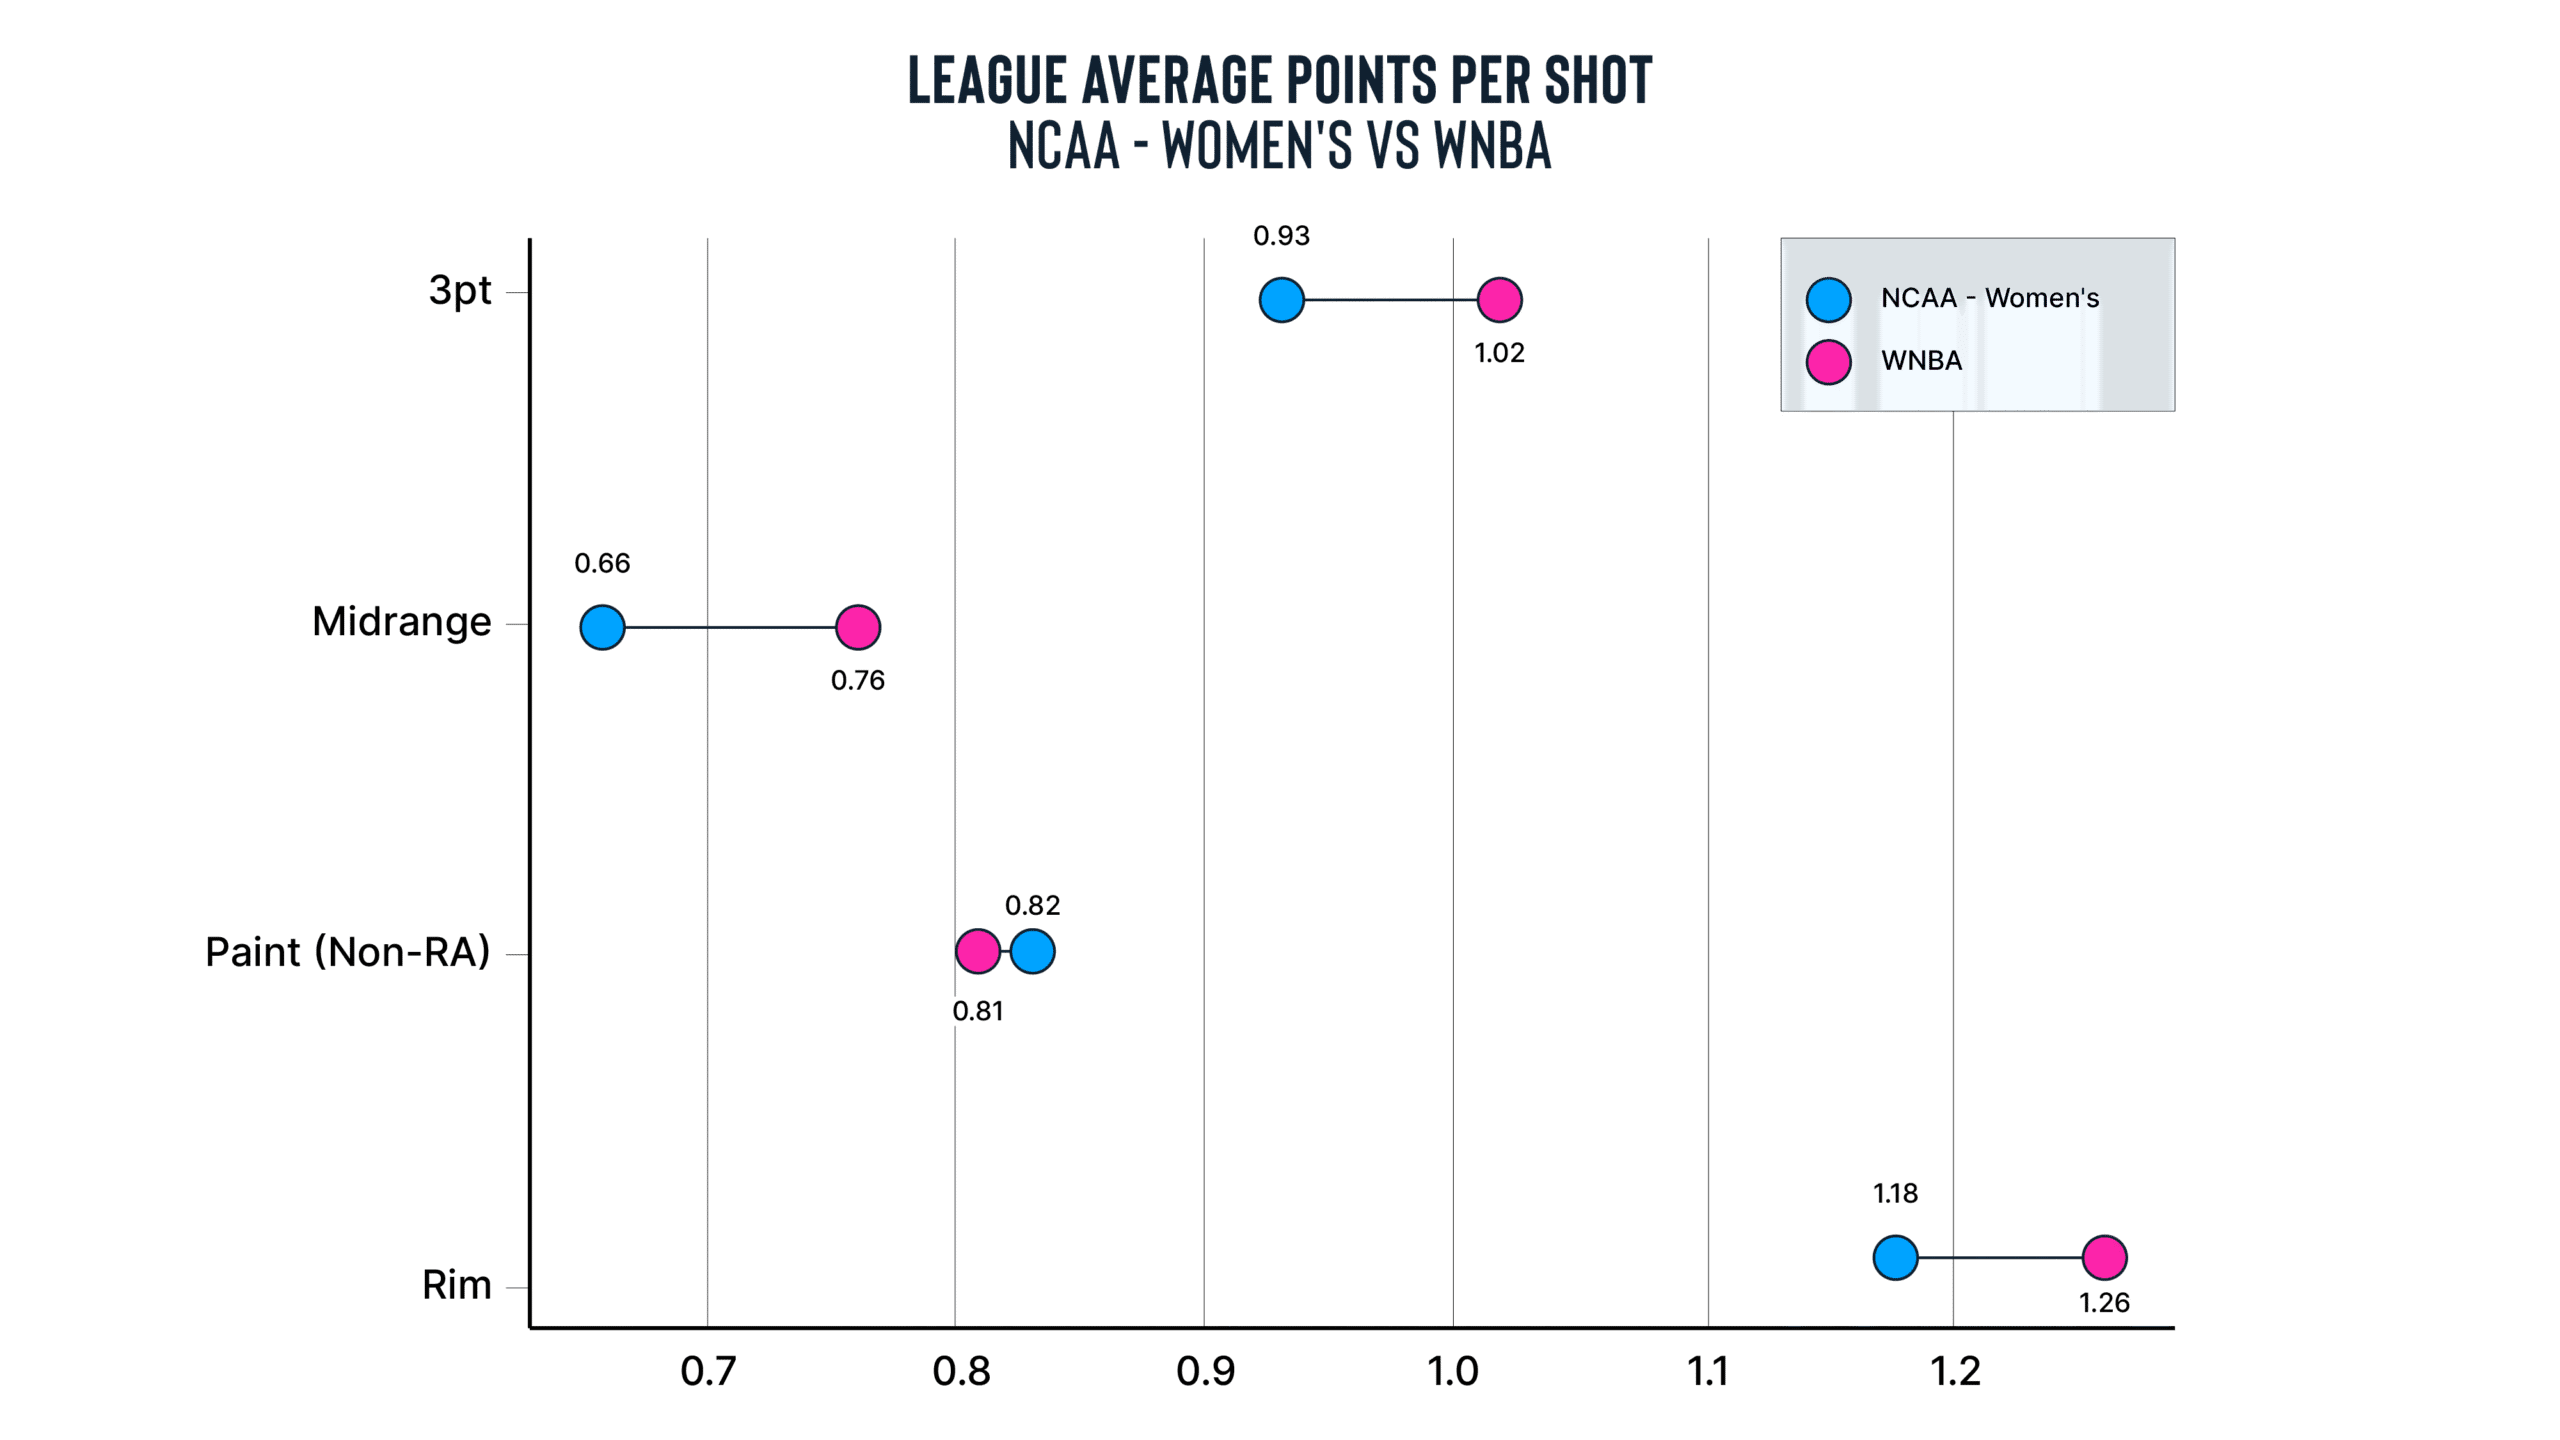
Yet in the NBA, teams convert those same looks into 1.09 PPS compared to 1.03 PPS in Division I Men’s basketball. In the WNBA, the story is the same with teams averaging 1.00 PPS compared to 0.93 PPS in Division I Women’s basketball. The difference is that professional teams are both picking better shots and converting them at a higher rate.
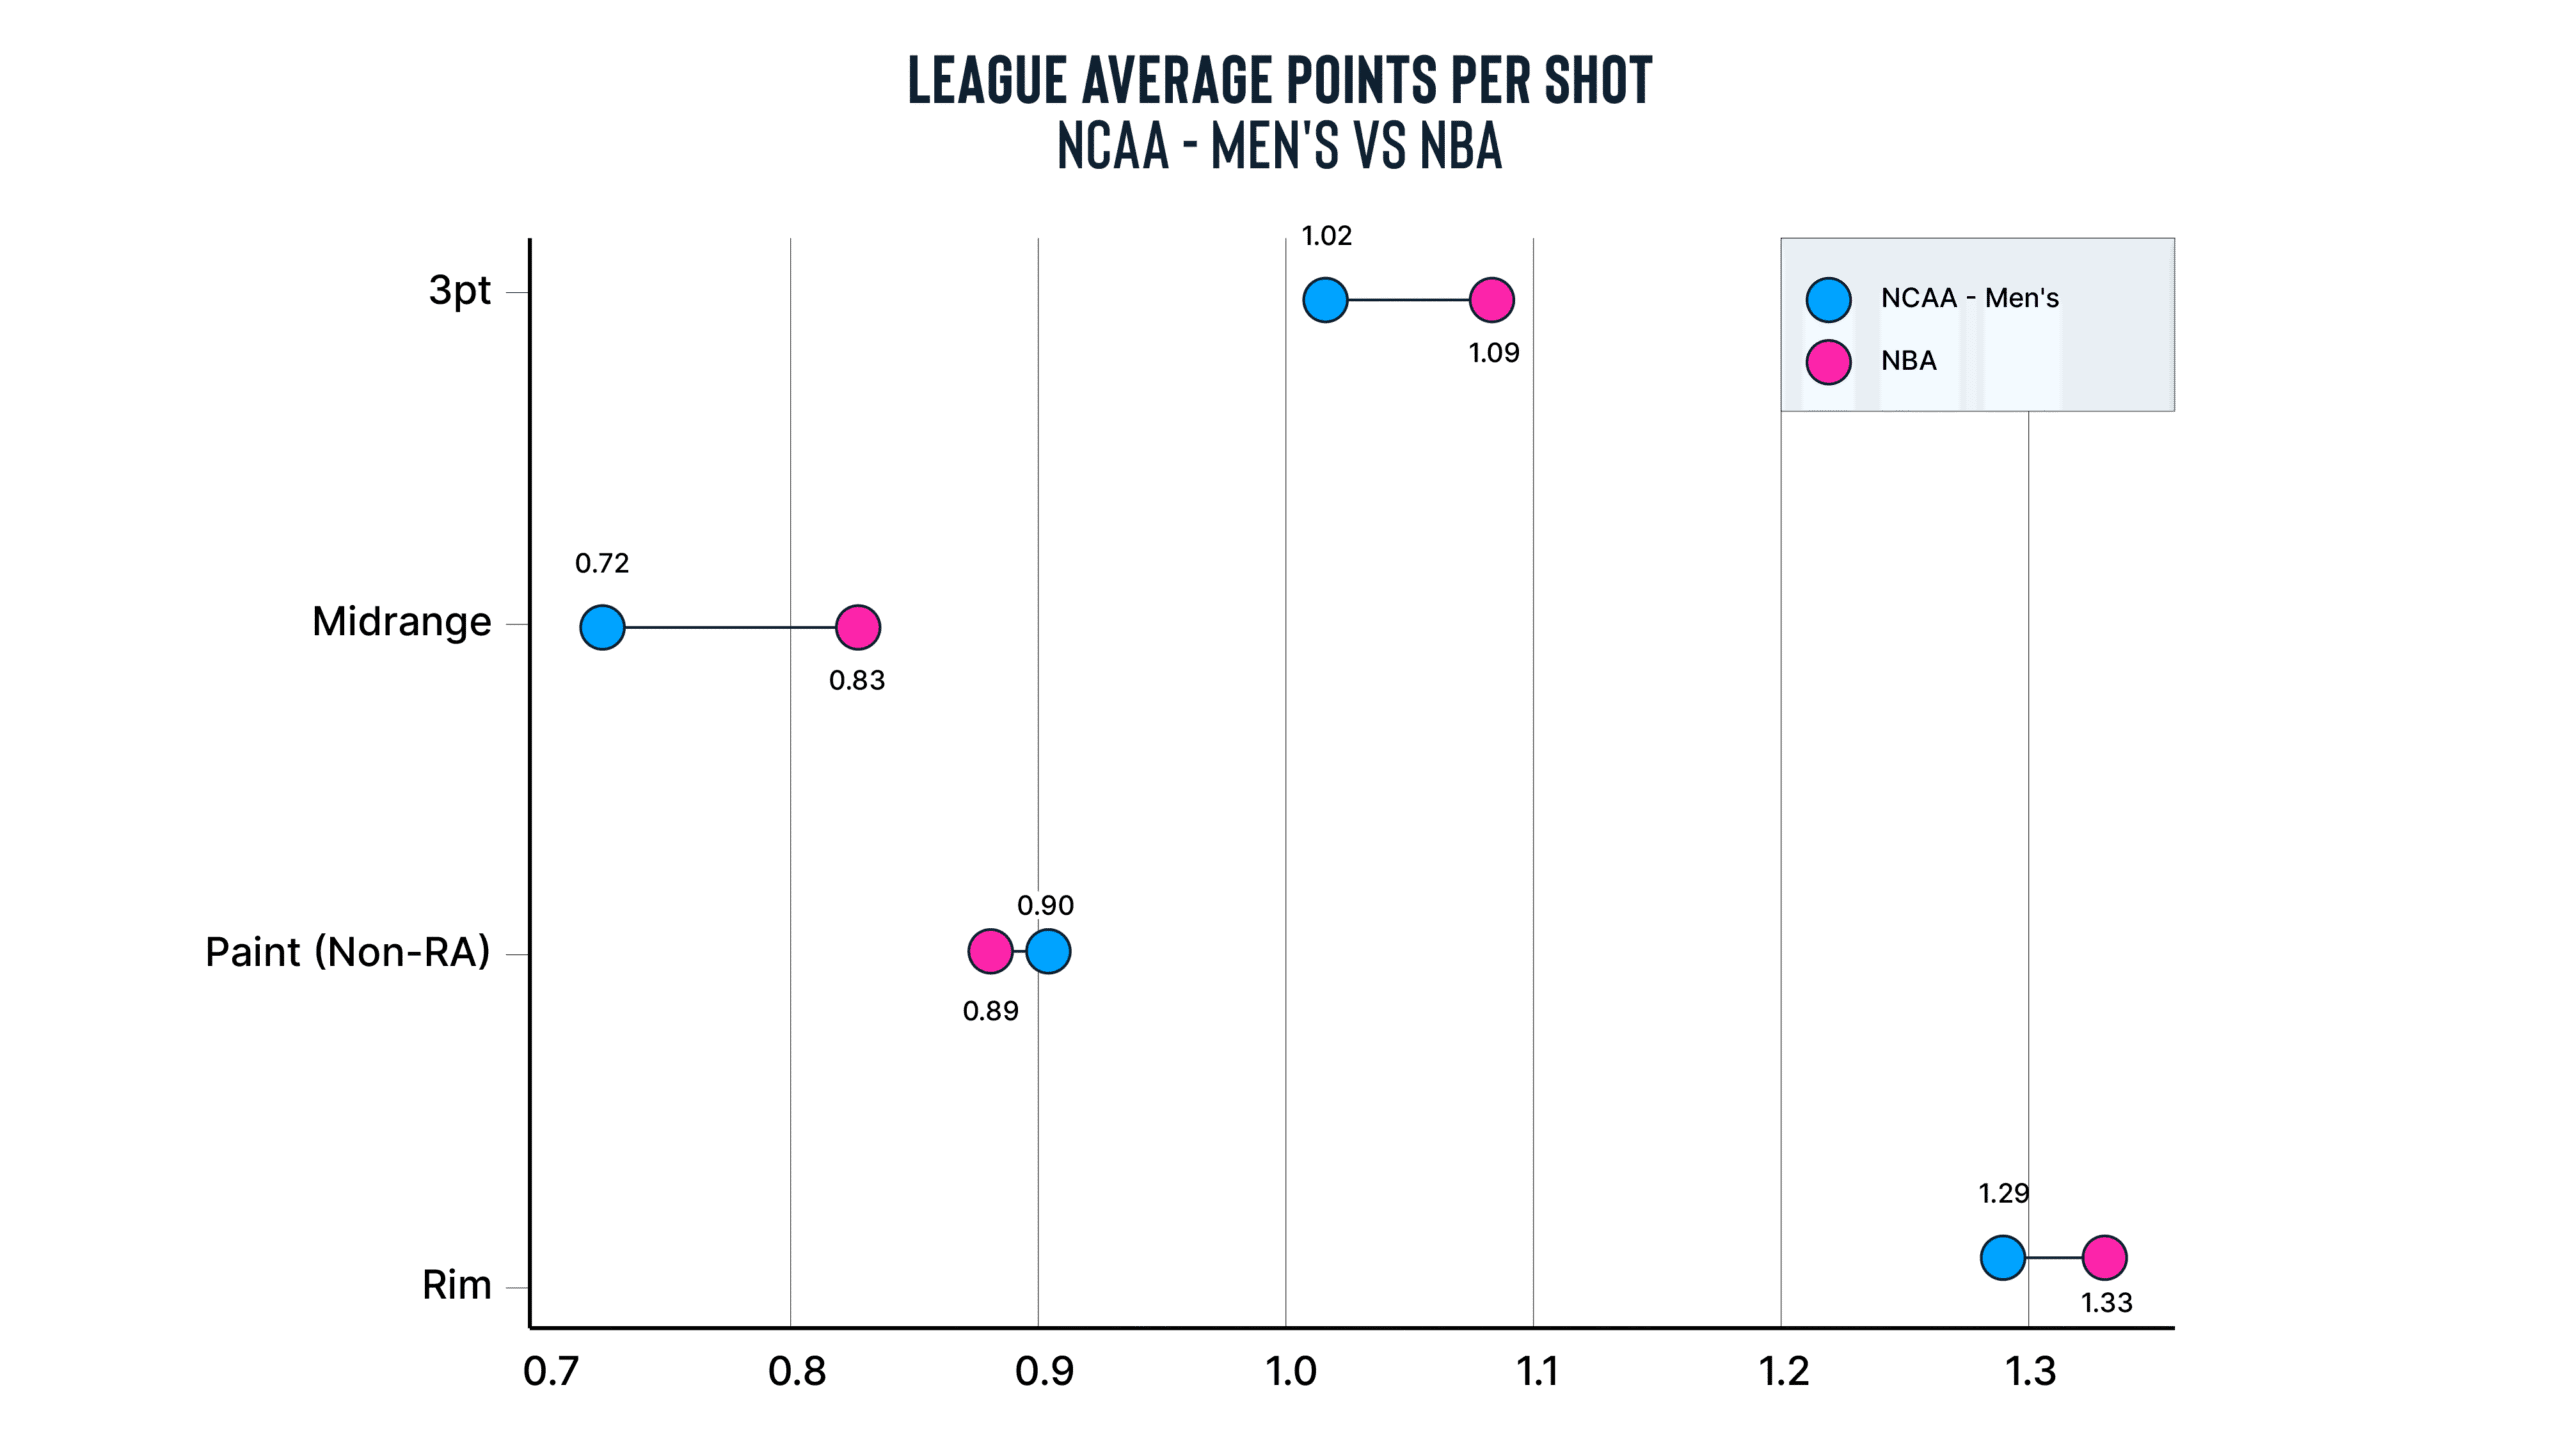
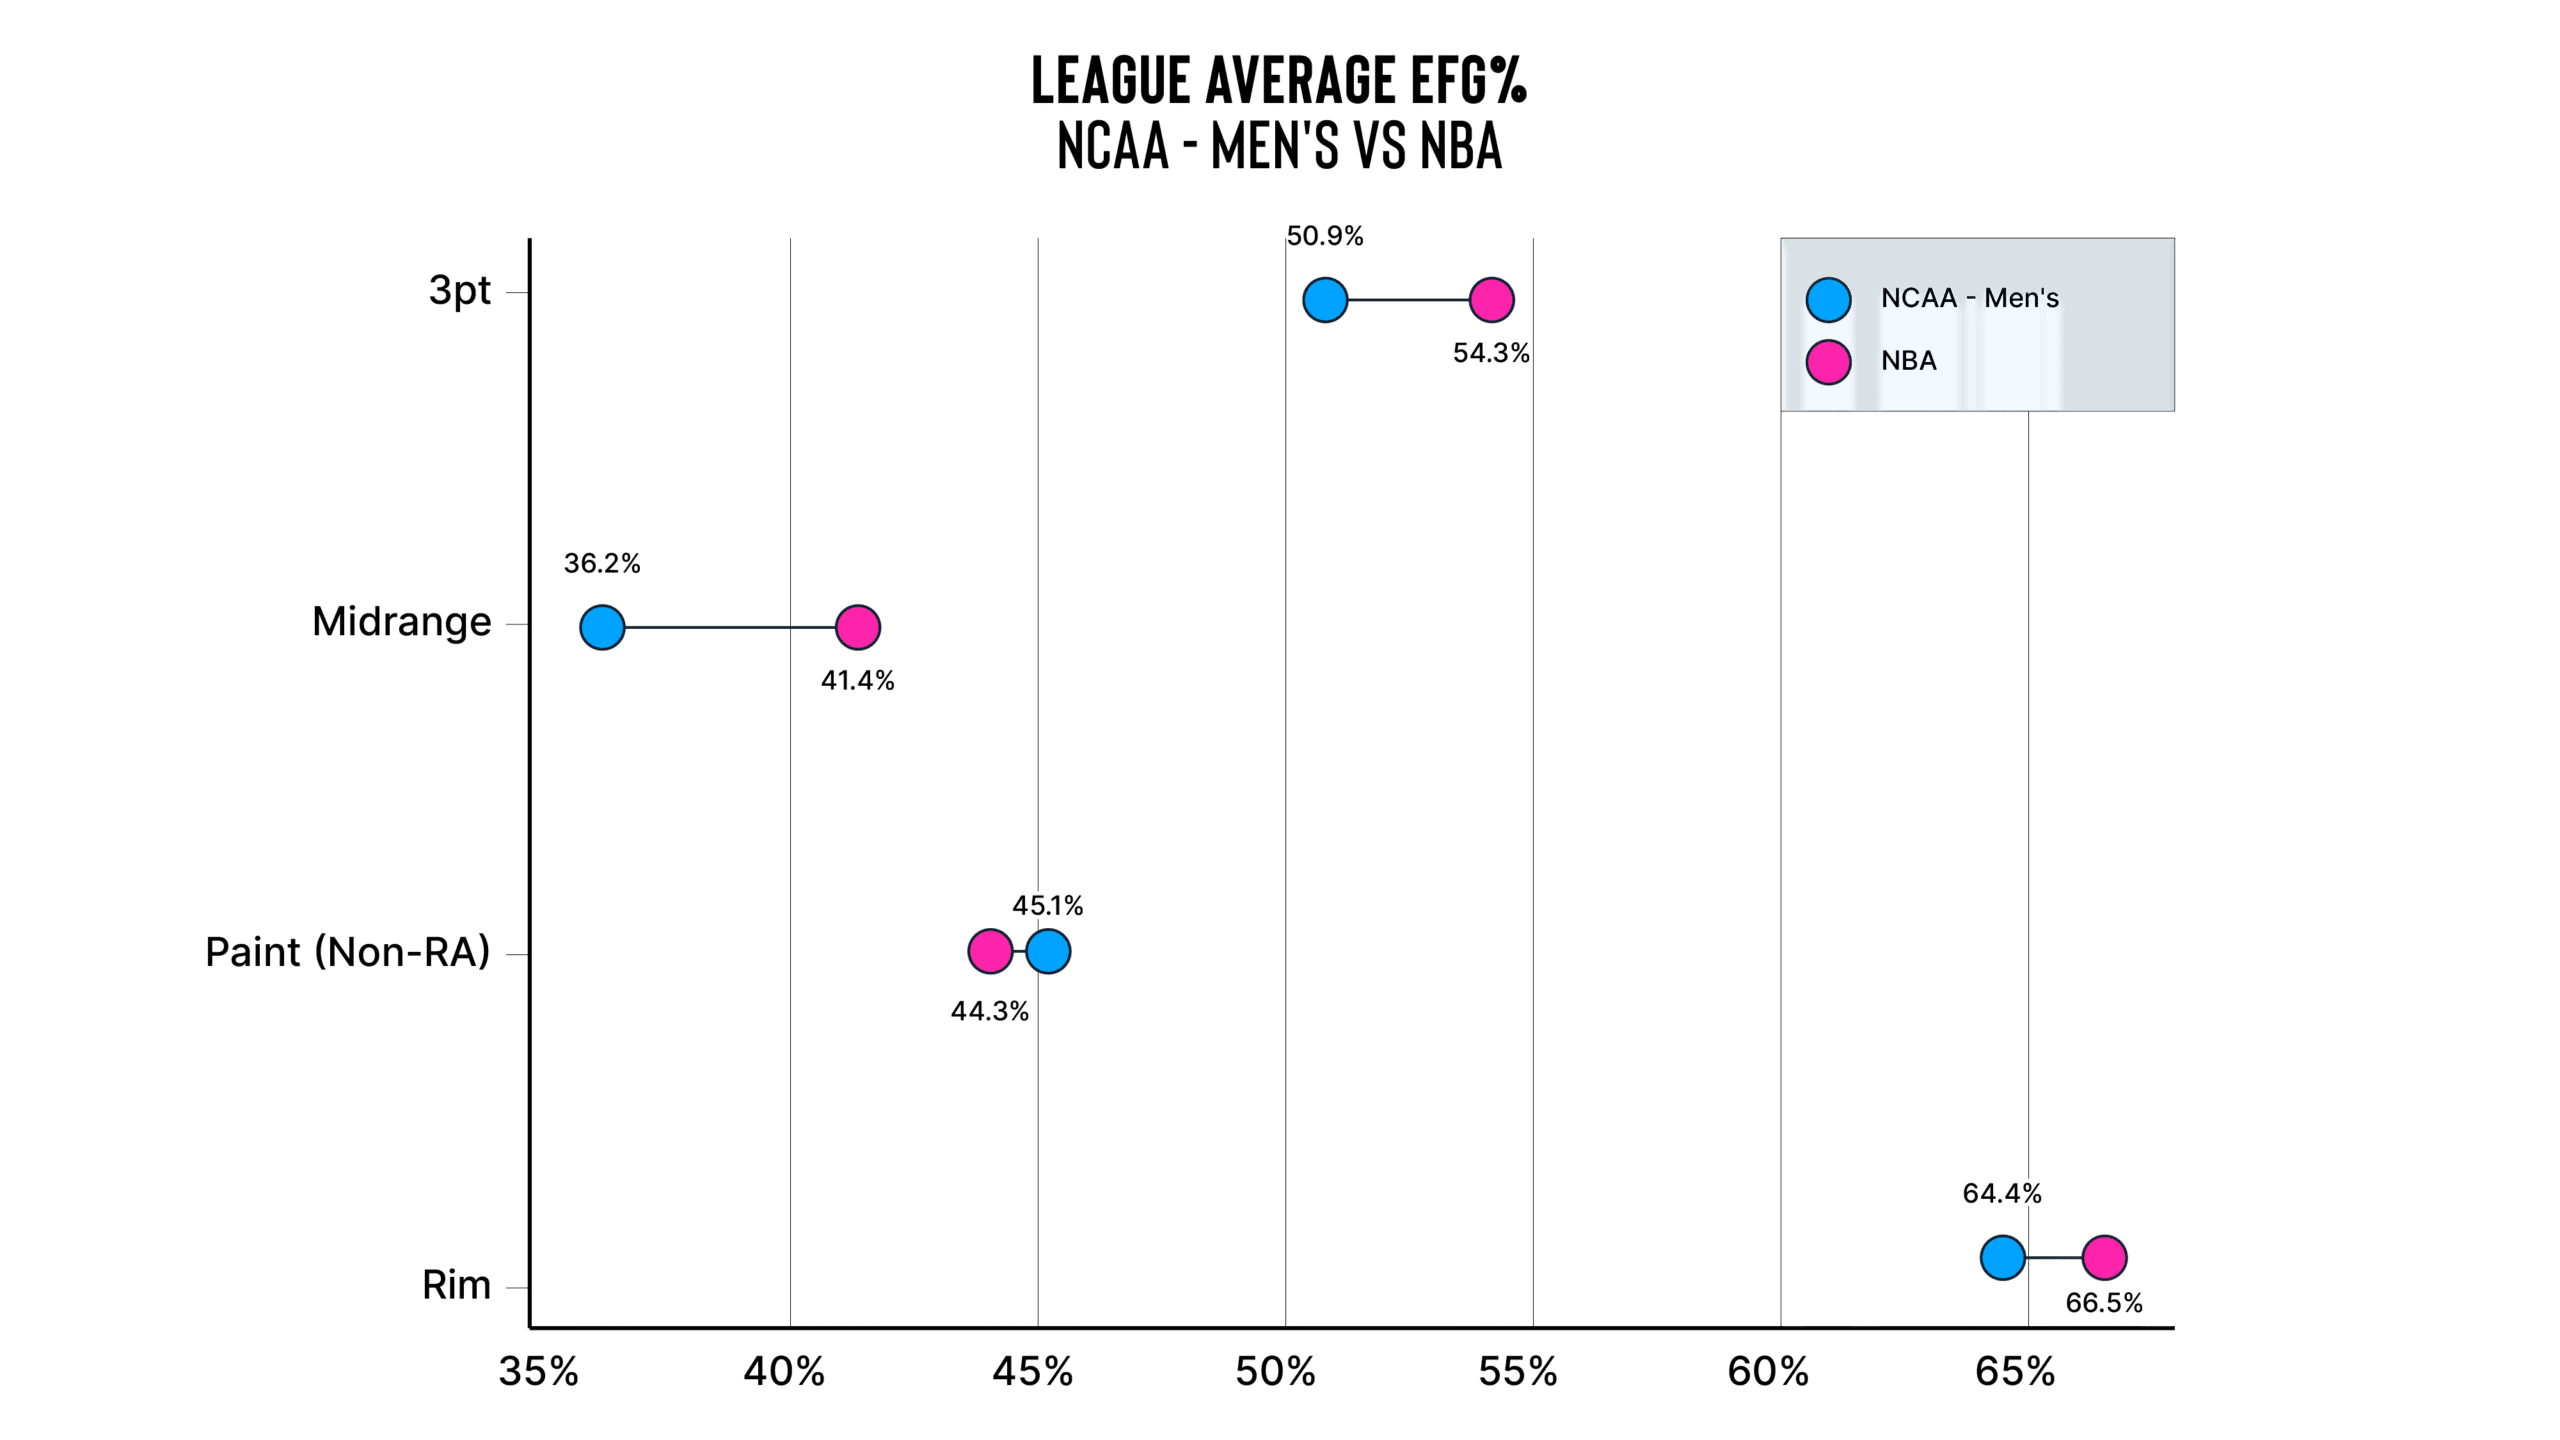
The gaps between the college and professional levels are further illustrated in the Dumbbell Charts below that visualize differences in Effective Field Goal (EFG%) and Points Per Shot (PPS).
Mind the Gap: Shot Efficiency from College Basketball to the League
The last point to make on the separation between NBA/WNBA teams and the Division I college teams is illustrated in the scatter plots below. Mapping 3-point frequency vs. shot efficiency (measured by weighted PPS), the professional teams are located in the upper half of the charts (higher PPS) and the majority of those teams are in the upper right quadrant – teams taking at least 35% of their shots from three.
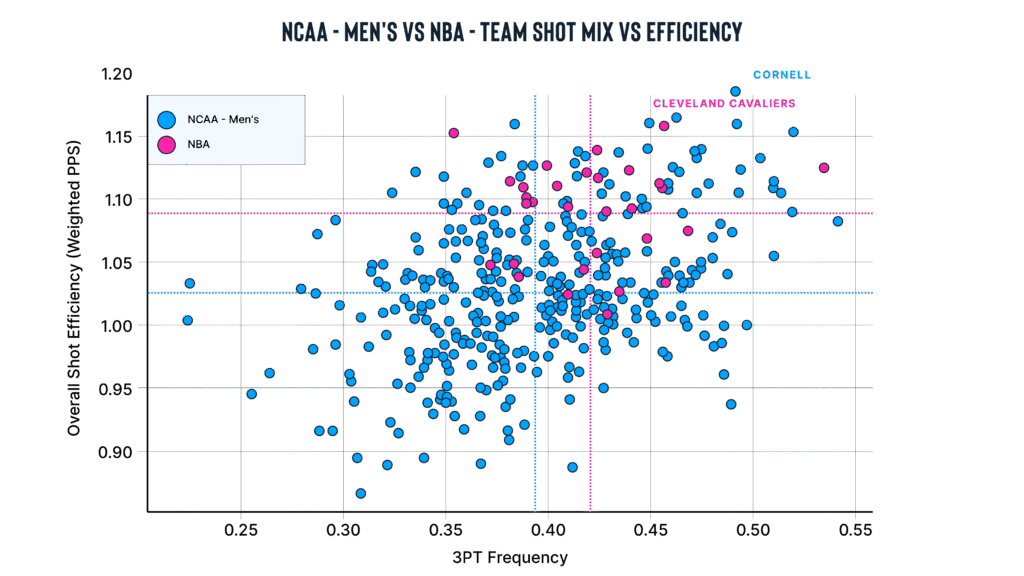
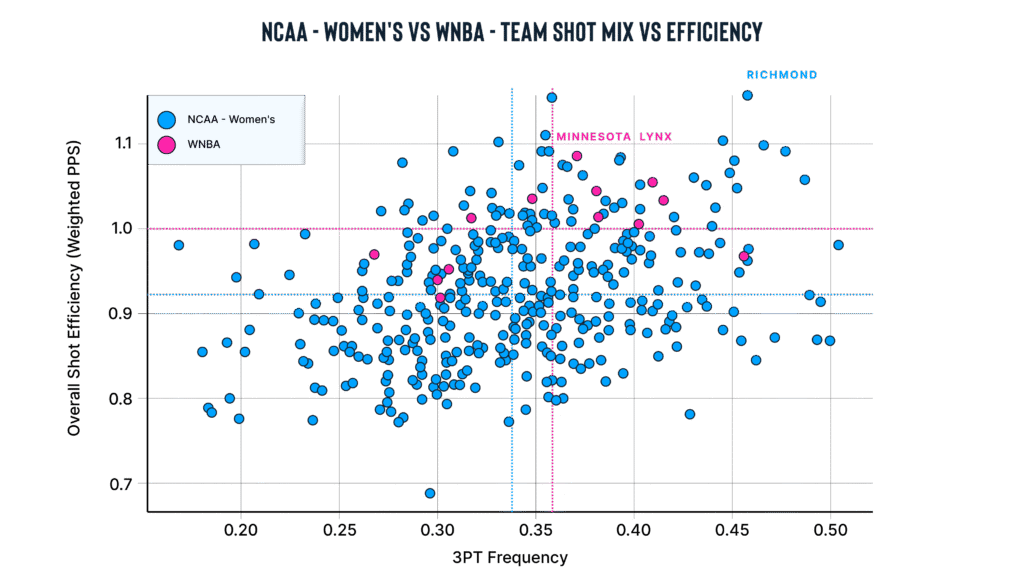
From these patterns, we can see that professional teams aren’t necessarily taking different types of shots — they’re just turning similar opportunities into points more efficiently. But within each level, not all teams look the same.
Next week in Part 2, we’ll explore how distinct offensive identities emerge across leagues, and how those styles connect to winning. Stay locked in, it’s coming…
Until then, explore more at ShotTracker.com