ANALYTICS & SHOT SELECTION
There is an undeniable analytics movement across basketball. Coaches from the professional ranks to youth programs are looking for better ways to gather and analyze information about their players and opponents.
It is no surprise that the NBA, the world’s most advanced basketball league, has been a leader in the analytics movement. Since 2013, the NBA has had an elaborate and expensive camera based system that provides spatial tracking for games. This means they have data on the location of the ball and each player throughout the contest.
Analytics have impacted the way the game is played, and the most obvious example of this is shot selection. With analysis of NBA spatial tracking data, we can understand the value of each shot in three interesting ways.
1) Shot Location
Coaches have long cared about the location of shots. Even at the high school ranks, a team manager is typically responsible for recording shot charts. Coaches understand that some shots are better than others, and shot charts can be a key indicator of how teams and players are performing, which may not be fully captured in a box score.
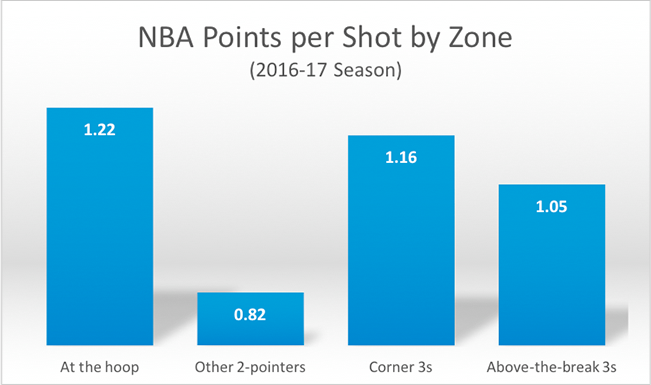
With a season of NBA data for all 30 teams (which means thousands of shots), we can quantify the exact value of different shots for this elite group of athletes. The chart below demonstrates that shots at the hoop and from behind the arc are considerably better than mid-range 2-pointers. For every corner 3pt shot taken, an NBA player is likely to earn, on average, an additional 0.34 pts per shot more than had he taken a mid-range 2-pointer. In other words, if an NBA team can swap 10 mid-range jumpers for 10 corner 3s in a game, they’ll get 3 to 4 more points. 4 points may not seem like a lot, but 21 of Dallas’ 82 games during the 2016 season were decided by 4 points or less (and that’s not unusual for an NBA team). This information is the basis for the NBA’s trend towards more 3-point shots.

2) Contested or Uncontested
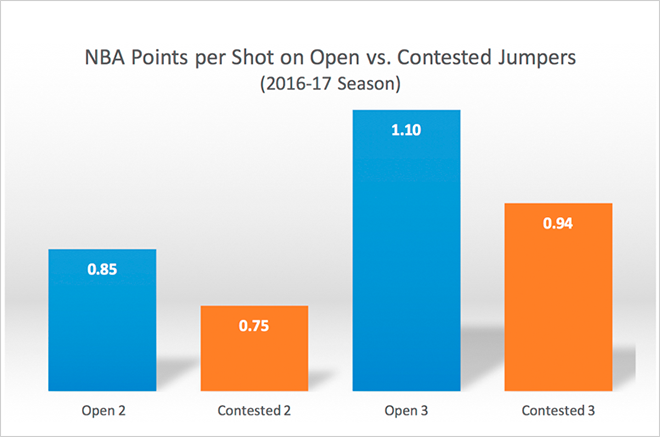
Shot location is a valuable indicator of the quality of a shot, but it is not the only variable we should consider. If we know the locations of the defenders at the time of the shot, we know whether or not the shooter was open.
The chart below demonstrates what every coach knows, that open jump shots are a far better choice than contested jump shots.

3) Dribble or Spot Up
The last major category we can track is whether or not a player dribbled into his shot (otherwise known as a pull-up jumper). This statistic has been incredibly informative in the NBA. It can tell us, for example, that Carmelo Anthony generated 1.15 points per attempt when he could catch and shoot this season. In contrast, he only generated 0.88 points per shot when he dribbled into his attempt. In spite of this, he took almost twice as many pull-ups as catch-and-shoot jumpers.
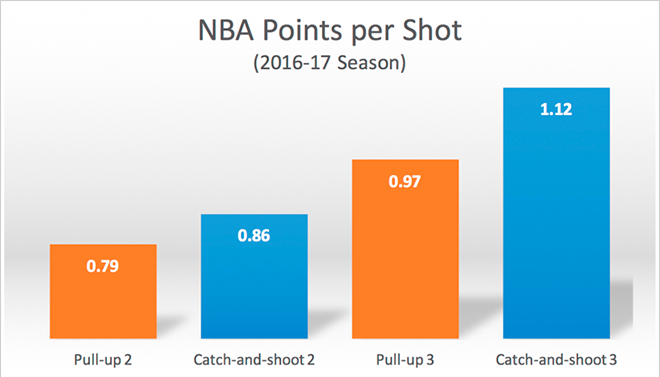
The chart below shows that, across the NBA, catch-and-shoot jumpers are significantly better performing than pull-up jumpers.

Pull-up jumpers are more likely to be contested. So, it’s no surprise that pull-up 2s have a similar efficiency to contested 2s and likewise for 3s.
In spite of the craze for 3-point shooting, shots at the hoop are still the best. Of course, shots at the hoop are not always available. Teams need to find an inside-outside balance. Putting the above information together, we see that the best jumpers are open catch-and-shoot 3s.
While the average team can learn from the NBA data, it’s directional at best. How can a high school or college team get such detailed information on their own performance?
That’s where ShotTracker TEAM comes in. It’s a new system that once installed in a gym, automatically tracks virtually every statistic for your entire team -- all in real-time. Coaches and players get the data as it happens, with analytic tools that make it actionable. Watch this video to see how it works.
The analytics movement is about providing coaches with more information with more insightful and actionable analysis. With shot selection data, coaches can design their offense to leverage their players’ strengths. With shot selection data on the competition, the defense is more prepared. Reliable data helps players better understand their performance and enables coaches to reward players that are making the right decisions. Simply put, the more analytics can inform coaches, the more effective they will be.

